Workplace digital signage template: 'Graph Performance'

Transform Data into Insightful Visuals!

This template is designed to enhance your internal digital signage communications. It displays result for top sales staff, best-selling products, or highest-performing retail outlets. The slide visualizes data in percentages or dollar values, with totals prominently displayed at the top of each column. Segment and highlight different business groups, and ensure that your sales opportunities and pipeline data are communicated clearly and effectively.  

Performance Tracking
Visualize monthly employee performance to motivate your team and highlight key achievements. 

Project Progress Updates
Keep everyone in the loop with real-time project updates and milestone tracking. 

Engagement Metrics
Display employee satisfaction scores and engagement metrics to foster a positive work environment. 

Financial Overview 
Present financial data clearly and concisely for executive briefings and stakeholder meetings. 

See all Vibe features See all Vibe features

How do I start using Vibe.fyi templates?

Already a Vibe.fyi client?
Login to your Portal and 'Create a new slide' using this template. For adding content, take a look at our help guides.

Visit Knowledge Base Visit Knowledge Base

Not a client yet?
You'll need a Vibe Subscription to discover how easy it is to visually communicate with your workforce.

Start a free trial Start a free trial

Workplace digital signage templates: for Insights

Organise and promote events with clarity and style. Whether it's a team meeting, conference, or special occasion, these templates help you manage schedules, countdowns, and room bookings to keep everyone in the loop.

Data, KPIs, Metrics, Dashboards, Goals, Performance, Analytics, Stats, Comparisons, Reports, Charts, Visualisation, Milestones, Dials, Progress, Targets.
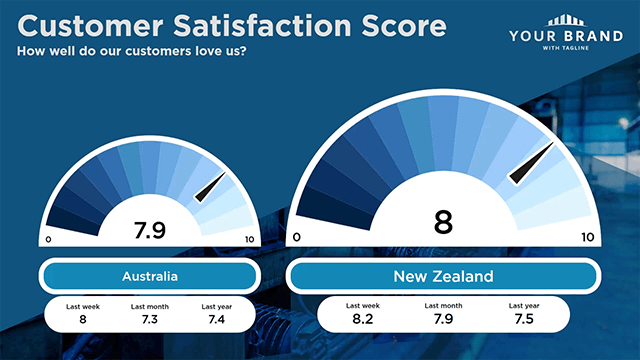
Data (Dial Comparisons)

Data (Stats)

Data (Plot)

Graph Goals


View all Insights Templates View all Insights Templates

Frequently Asked Questions